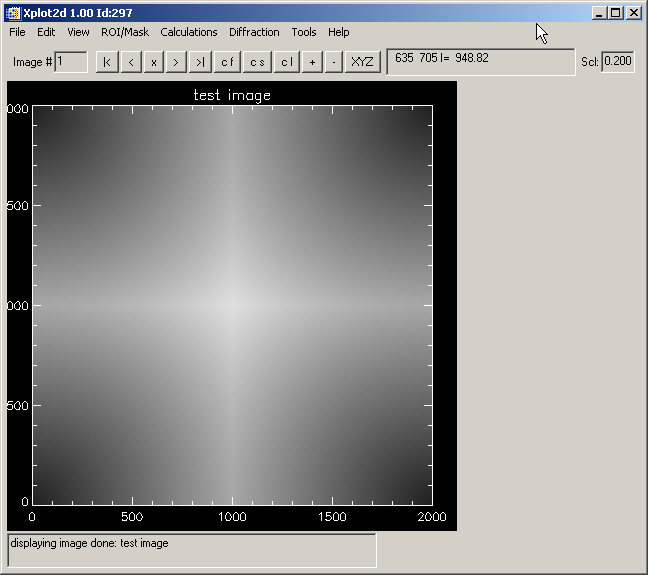
When you start Xplot2d (usually from Xop->Tools->Xplot2d) you get the window:

Because Xplot2d is used with large images, the image is scale to fit in the screen. The access to the scale menu is in View->Scale on Images (default 0.20). This scale is also available on the top-right angle of the main screen.
Use File>Load Image to load an image. The first time you load an image you should tell Xplot2D your image format and other parameters. You can use File->Set load image properties&ldots; to change it. You get this window:
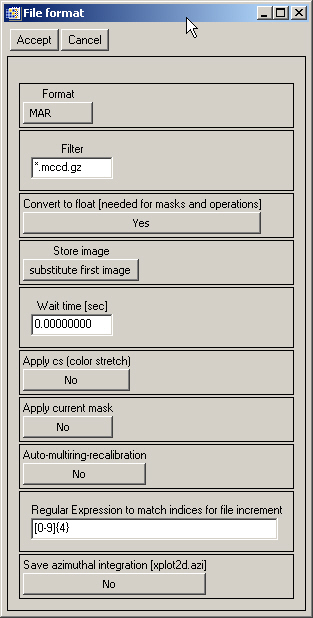
Description of the entries
Format: Select the File format of your choice
Filter: Define the filter matching the extension of your file. In the case of MAR files, you can read directly the gzipped files, for that, simply add the .gz to the file extension. This is not working for EDF.
Convert&ldots; Yes [RECOMMENDED] If setting No, the data type will be kept and not converted to float. This may led to an overfloat when making operations.
Store image: in Xplot2D you can work in two modes,
storing (i.e., keeping in memory) multiple images (Use: add image)
replacing the existing image in position #1 (Use: Substitute first image)
Wait time: waiting time when reading several images (to permit the users to digest the information)
Apply cs (color stretch): If yes, the color table is
changed to  after reading each file (RECOMMENDED: YES). If Not, it keeps
the current color table (you can also use the
  button to match the color table with the
full data range)
Apply current Mask: if Yes, the mask set in the current image is copied to the newly loaded image
Auto-multiring-calibration: It will recalibrate the detector parameters (for diffraction or scattering). RECOMMENDED: NO (For advanced users)
Regular&ldots;. This option is very useful to load files
with an index that is increased sitting all in the same directory. For
that the  and
and  buttons should be used. In order to let Xplot2D to know how
to increment (decrement) the index in the file name, you should enter
here a Regular Expression that match the index in the file string.
Save azimuthal&ldots; If Yes, a file xplot2d.azi is created or updated in the Xplot2D current directory. It will contain the results of every calculated azimuthal integration (called manually or automatically updated when loading new files). RECOMMENDED: NO (For advanced users)
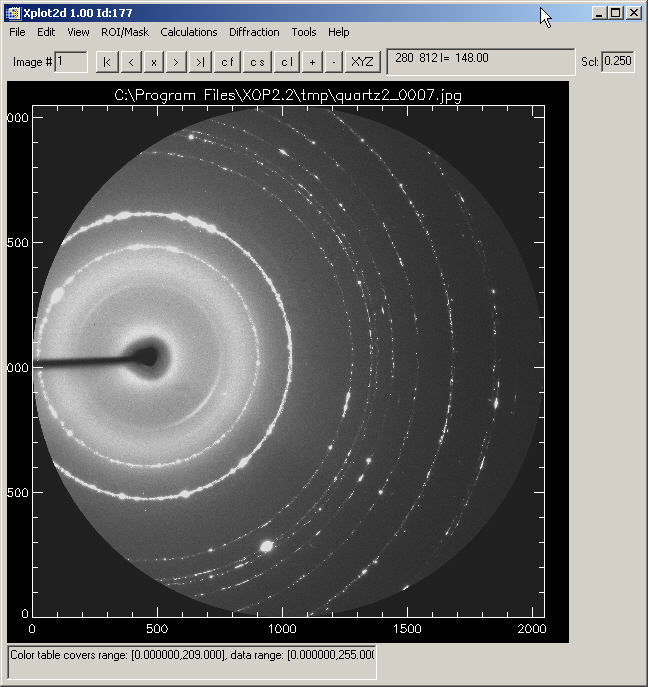
As an example, select PNG/TIFF/etc. format and load the image quartz2_007.jpg
that you can find in the "examples" directory of the XOP installation.
It corresponds to a diffraction pattern of quartz powder. You will never
find a scientific image recorded in jpg format, because it is a compressed
format with loss of information. However, for learning some of the features
of Xplot2d this file is sufficient. After reading a data file and using
color stretch (either defined in the loading menu, or by pressing the
 button) and you will get something like:
In the Edit menu, you have:
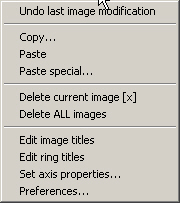
a 1-level Undo (for undoing image modifications)
Copy/Paste the current image (via a variable in the Main IDL level). You can use this variable to export the image to other applications. For instance, copy the image and enter in the Cmd pod of the main XOP window the command: iimage,CLIPBOARD_XOP. You will find your current image in the iimage application.
and you can also ”reset axis properties” in order to label the axis with numbers related to your physical quantities and not pixel number.
In Preferences... you will be able to define some parameters specific for the azimuthal integration (see later).
In the View menu you have a number of options to display better your image.
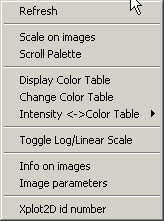
You can define here the scale factor. If the scale factor is high, your image may not be fully displayed in the screen. In such a case, you should use the Scroll Palette to move the image in the view window. Also in this case, you could pick and displace the image with the mouse.
This menu also includes tools to better match the image intensity with
colors. Particularly useful are the items "Toggle Log/Linear Scale"
and "Intensity <->Color Table". The latter includes the
"color stretch" also available with the button  in the main panel.
The Xplot2D id number (also displayed in the main bar) is useful to paste images from one Xplot2D window to another (using Edit>Paste special...)
In the Calculation menu you will find:
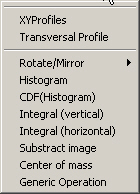
XYProfiles: A new window should appear. Move the cursor over the original image to see the profile at the cursor position. Press the left mouse button to toggle between row and column profiles. Press the right mouse button (with the cursor over the original image) to exit the routine (DO NOT KILL THE PROFILE WINDOW)
Transversal Profile: Click two points in your image to get a new Xplot window with the transversal profile
Some options for operations (Image rotations, Integrals)
You can use ”substract image” to substract a (noise) image. For this, you need to have both the data image and the background image stored in Xplot2d (i.e., you should select ”r;add image” in the store image option File>Set load image properties...).
With ”generic operation” you can define your own image transformation.
The histogram makes the intensity histogram. Be ready to use the zoom to see in detail the wanted area.
You also find a Toolbar in the main Xplot2D window:

The Image number permits to navigate between images (when ”add image” is selected in the store image option File>Set load image properties...). Also the "|<", "<", ">" and ">|" buttons.
The  button deletes the current image.
Use "cf" (color full) "cs" color stretch and "cl" (color Lin/Log) to apply these useful color options.
The buttons "+" ("-") are for increasing (decreasing) an image in the current directory, using the "regular expression"syntax defined in File> Set load image properties...
The  button permits to toggle the cursor position from
the standard (pixelX, pixelY and Intensity) to "diffraction"
(2q, d-spacing, Intensity).
See Diffraction for more information.
A zoom tool is not directly integrated in XPlot2D. However you can zoom the image by
Changing the scale factor to a larger value. If the value is large only a part of the image appears in the window. You may use the "View>Scroll palette" or the mouse to change the image window.
Select a rectangular ROI of the area you want to zoom, and "ROI/Mask> Crop/Export last polygon ROI" to another Xplot2D window. Increase the scale factor in this new window. Alternatively export to other application.