Once one has the experimental data cleaned in some way (after doing some manipulation of data analysis or data reduction), one will probably want if the data agrees with some ”r;model” which is expressed in terms of a mathematical function that depends on some parameters. The goal of the fitting process is to adjust this parameters to the data itself.
It is possible to develop methods which allow to fit data to a straight line or to a polynomial without any ”r;a priori” estimation of the parameters. Xplot includes the following algorithms in the Xplot>Calculations>Fit &endash;
Polymomial&Gaussian&ldots; entry:
Chi-Square Linear Regression. It uses the IDL LINFIT function, which fits the paired data {xi, yi} to the linear model, y = A + Bx, by minimizing the chi-square error statistic.
Robust Estimation Linear Regressionv. It uses the IDL LADFIT function, which fits the paired data {xi, yi} to the linear model, y = A + Bx, using a "robust" least absolute deviation method.
Least Square Polynomial Fit. It uses the IDL POLYFITW, which performs a least-square polynomial using matrix inversion to determine the coefficients.
Singular Value Decomposition Polynomial Fit. It uses the IDL SVDFIT, which performs a least squares fit using singular value decomposition (SVD) It is based on the routine with the same name of Numerical Recipes in C: The Art of Scientific Computing (Second Edition), published by Cambridge University Press.
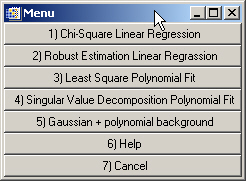
Use Xplot>Calculations>Fit &endash; Polymomial&Gaussian&ldots; option and select entry 5) Gaussian + polynomial background. Then select the wanted polymonial degree (up to a 2). It uses the IDL GAUSSFIT function which performs a non-linear least-squares fit with this predefined function.
The option Calculations>Fits - Peaks/Non linear. exports the current data to the FuFiFa application, which allows performing non-linear fit with a user defined function. As an example, we want to fitting data to to multiple peaks (Gaussians and/or Lorentzian)
1) Create some fake data consisting in three Gaussians plus a noise. For that you can use Tools>XOP macro, click "No"at the question of loading current graph, and enter and run the following text:
;
; create data set ( 3 gaussian + noise)
;
sigmas = [10.0, 50, 10.0]/(2.0*sqrt(2*alog(2)) )
x=makeArray1(100,0,100)
y1= 5.*exp( -0.5*( (x-10.)/sigmas[0] )^2 )
y2= 10.*exp( -0.5*( (x-50.)/sigmas[1] )^2 )
y3= 30.*exp( -0.5*( (x-70.)/sigmas[2] )^2 )
ynoise = 0.5*randomu(seed,100)
y0=y1+y2+y3
y=y1+y2+y3+ynoise
;
; write data to a file (not needed)
;
OpenW,unit,'fakedata.dat',/Get_Lun
FOR i=0,99 DO printf,unit,x[i],y[i],y0[i]
Free_Lun,unit
itmp = Dialog_Message('File fakedata.dat written to disk.')
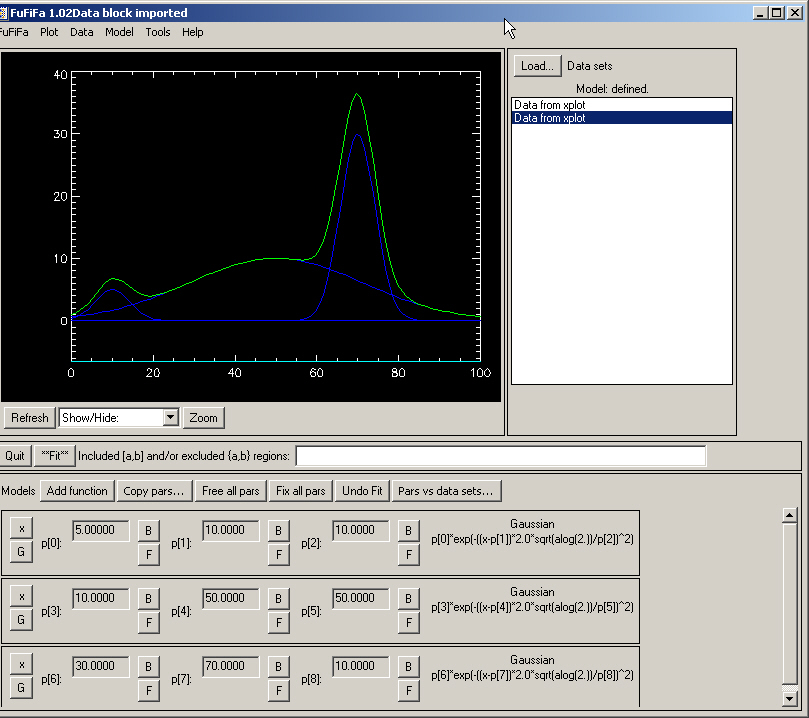
Note that data are saved in a file "fakedata.dat" with three columns, abscisas, data with noise, and data without noise. Quit the XOP Macro window, and Open the resulting file (fakedata.dat) with Xplot. If needes select columns 1 and 2. Call Xplot>Calculations>Fit &endash; Peaks/Non linear&ldots; You will get the data in the fufufa window.
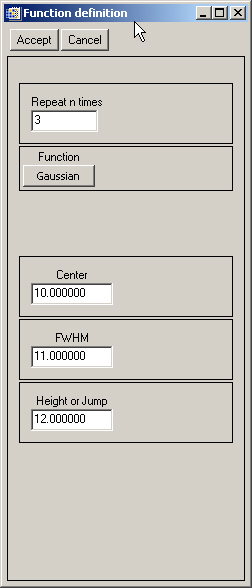
Click "Add function" button, and select 3 Gaussian functions: We know that there is no background. Leave the default values for the Center, FWHM and Height or Jump (they will be changed later).
Click the ”r;G” button of each Gaussian line and click the approximated width and peak for each Gaussian (staring values). Then click "**Fit**"and then "Refresh". You get the result:
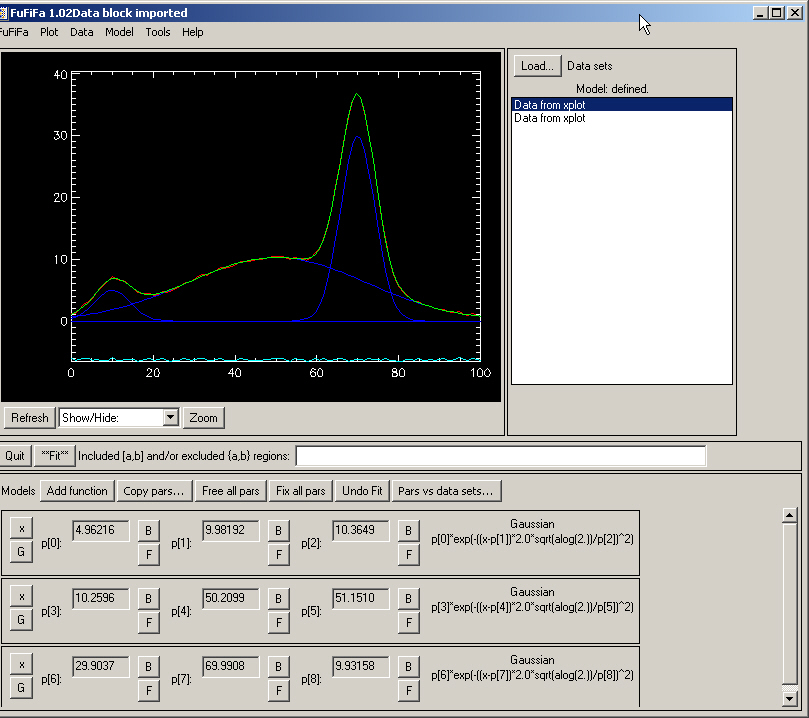
You see a good fit, even though the resulting values (center, FWHM and peak) are not identical to the ones used for creating the data. This is due to the noise. For checking that, come back to the Xplot window, select columns 1 and 3 (i.e., data without noise) and Calculations>Fit - Peaks/Non Linear. Append these data to the existing one and you will see a second line in the text window on the right of fufifa window. Click on this second line, and fit again, you will see a perfect agreement.