
A SPEC file is an ASCII file containing one or several blocks of data (called scans, the same as what we called sets) preceded by a header. Any header line is preceded by a # symbol #. After the # it contains a letter (or set of letters) to define keywords. Many standard and user-defined keywords can be present in a SPEC file. However, Xplot needs only three keywords: #S to indicate the scan number and its title, #N with the number of columns, and #L with the labels for the columns separated by double blank.
Xplot has the availability of visualizing and analyzing SPEC formatted data. It includes tools to navigate between the different data sets stored in a SPEC file, and therefore to apply all the Xplot options to these data.
In order to store a SPEC data file in Xplot, use the File>Load data File... option and select a SPEC file. Once you have done that, the first scan in the file is displayed in the Xplot window, and the bottom part of the Xplot window changes a bit its aspect, allowing to change columns with a pull-down menu and to change scan number with the ”r;Sel Scan&ldots;” button.
Warninig: A SPEC file for Xplot must be ASCII, with the corresponding end-ofline character correctly set. This means that if you transfer to your windows-PC a SPEC file created in a Unix workstation using ftp in binary mode, or simply dragging it to your PC, you may not be able to open it with Xplot. You need to create the correct end-of-line characters (for example by opening and saving it with WordPad, not with Notepad).
For example, let us build a SPEC file with the data we used from tmp.dat and tmp2.dat. Let us call the new file tmp_spec.dat:
#S 1 set from tmp.dat
#N 2
#L x y
0 3
1 4
2 11
3 30
4 57
5 48
6 39
7 46
8 15
9 32
10 3
#S 2 set from tmp2.dat
#N 2
#L x y
7 3.0
8 4.0
9 11.0
10 30.0
11 57.0
12 48.0
13 39.0
14 46.0
15 15.0
16 32.0
17 3.0
Load it in Xplot:.
Now is possible to change the abscissas and ordinates of the current plot by using the drop-list widget with the titles of the SPEC columns in the current scan. In order to change scan number, just press the Scan
sel... button, and a new window with this aspect will be created:

typing its identifyer in the Scan id. plus <enter>. Please read the documentation of the SpecAccess library in order to know the possible identifiyers of a scan in a SPEC file. By clicking the exclusive buttons Counters/MCA, you may select data from the scans with the two formats allowed in the SPEC files: the standard one and the MCA (Multi Channel Analyser) one. It is possible also to use the cursor up and down arrows to navigate in the scan list. You can navigate and manipulate data in your display. Note, however, that possible modifications, etc, are not saved in the SPEC file, which remains intact.
You can see when you load a SPEC file that the SCAN number is displayed at the title of the plot and the column titles (motor and detector names, in the SPEC language) ate in the titles. For that some convention is needed. This is done in the Xplot>Edit>Titles&ldots; window.
In order to get the column names in the X and Y titles, you must put ”r;-1” in the corresponding title entry. In the main title, you can put a SPEC keywors (i.e., #S) and you will see in the graph window that the full line corresponding to that keyword appears. In the case that more than one keywords with the same value are found, Xplot displays the last one.
A SPEC data file contains many scans, but only a subset of them are useful. The first step in our data manipulation can be to remove bad scans and perhaps to select the useful interval for the good ones. For that, Xplot proposed a mechanism consisting in creating a new file, and copying there only the good scans in the wanted interval. We call that ”r;cleaninig”. For doing that, open a SPEC file. In the Scan selection
window (available by pressing the ”r;Scan sel&ldots;” button, you must select the new file name in the File|Define file for storing cleaned scans&ldots; option. Then go to the first scan. If it is good, select the X interval containing the good data, and click ”r;Add to file” button. If you want to write the whole interval, press first ”r;ReDraw” in the main Xplot window, and then you will be asked if you want to copy the whole scan to the file. You can use the cursor arrows to change from one scan to the next or previous one.
A better way to clean SPEC files, or to extract the good data is to use the EXODUS application, which allows better visualization than Xplot of multiple data sets.
You can display MCA SPEC scans with Xplot. You can visualize then either in ”r;channel” or ”r;energy” scale. The energy (or ”r;calibrated”) scale is calculated using the A, B and C coefficients available in the MCA data header after the #@CHANN keyword. The energy values E are calculated as a function of the channel values X with: E= A + Bx + Cx^2
Although Xplot has been designed to plot XY graphs, it can also display some graphs multiple data sets. A multiple data set is defined as a single data set with different plots one after the other. All individual plots must have the same number of points. The position where a plot ends and the next plot starts can be defined by the line position (or the number of points of the individual plots) of by an additional label column. The label column has a different value for each individual plot. Three kind of MESH view are possible: lines, surface and contour.
For example, load this into an XOP_MACRO and run it:
;
; makes an example of mesh data: scan 100 x values at 10 different times
;
time=[2,4,6,8,10,12,14,16,18]
x = makearray1(100,1,100)
tmp = dist(100,10)
openw,unit,'testmesh.dat',/get_lun
FOR j=0,N_Elements(time)-1 DO BEGIN
FOR i=0,N_Elements(x)-1 DO BEGIN
printf,unit,x[i],time[j],tmp[i,j]+randomu(seed)
ENDFOR
ENDFOR
free_lun,unit
itmp = Dialog_Message('File testmesh.dat written to disk')
xplot,'testmesh.dat'
Select columns 1 and 3, and View>Mesh plot... Set the controls like here:
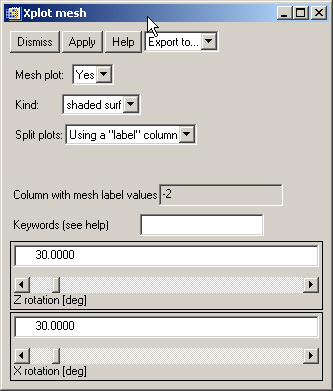
Note that we selected "-2" in the column with labels. The minus sign means that the values will match the array values. Plus sign will create inices and will not reflect the specific values (time in this case). See the help for further information.
You will obtain a surface plot like:

Xplot can make operations with data from different scans only by exporting one scan to an auxiliary external file, and using Xplot>Calculations>Operations with sets&ldots; Sometimes, the user may need a quick access to data from several scans and average and operate with these data. For that, it is recommended to use the Exodus application (available in the Xop>Tools).
It is possible to write XOP macros to perform iterative operations with Spec files. For that one should call directly the routines in the SpecAccess library. An example to split a Spec file in many files, one for
each scan, can be found in the file splitspec.mac.
close,/All
file=Dialog_PickFile()
root=file
n_n = Spec_Access(h,file)
itmp = Dialog_Message(/Info,'number of scans ='+strCompress(n_n))
FOR i_i=1,n_n DO BEGIN
header = Spec_Headers(h,i_i,/Index)
; itmp = Dialog_Message(/Info,header)
nCols = Spec_Columns(h,i_i,/Index)
nPts = Spec_Points(h,i_i,/Index)
; itmp = Dialog_Message(/Info,'nCols='+StrCompress(nCol)+' nPts='+StrCompress(nPts))
OpenW,11,root+'.'+StrCompress(i_i,/Remove_All)
FOR j=0,N_Elements(header)-1 DO PrintF,11,header[j]
IF NPts GT 0 THEN BEGIN
data = Spec_Data(h,i_i,/Index)
FOR j=0,nPts-1 DO PrintF,11,data[*,j],Format='('+StrCompress(nCols,/Rem)+'G10.5)'
ENDIF
Close,11
; itmp = Dialog_Message(/Info,'File written to disk: '+root+'.'+StrCompress(i_i,/Remove_All))
ENDFOR