XPLOT is a general package for creating X-Y plots that also allows for sophisticated data visualization, processing, manipulation and analysis.
application manual
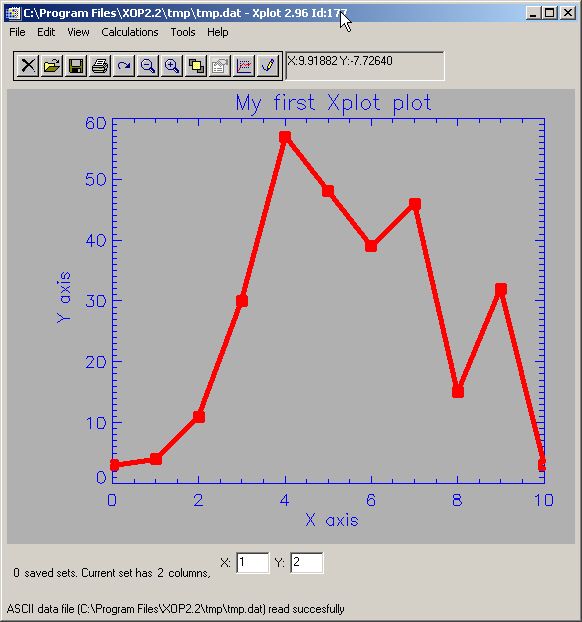
Launch Xplot. Window overview
Create a line plot
Overplotting and printing
Activate the data for analysis
Definitions
Overplotting sets (creating compound plots)
Selecting, zooming and setting plot limits
Data analysis
Operations with columns&ldots;
Operations with sets&ldots;
Advanced features: XOP macros
Fitting data to a polymonial
Fitting data with a Gaussian with a polymonial background
Non-linear fitting (predefined functions)
Generalities
Change information in titles, scans, etc.
Cleaning files
MCA
MESH/Surface plot&ldots;
Operating with scans (Exodus)
SpecAccess library and XOP macros