
A software tool for the analysis of scientific images.
Some characteristics are:
Load and visualize several images
Several file types: EDF, MAR, BINARY, XRD, etc.
Automatically handles gzip MAR compressed files
Loads multiple files
When an image is load, it can be added to the image stack or substitute the first image in the stack.
Visualize images in frames.
Apply several color tables and adjust their limits to data.
button: "c f" color full range
button: "c s" color stretched range
Define ROIS (rectangle, circle, cake, polygon)
Mask data to ROI or complement of ROI (1-ROI)
Applies mask from another image
Define/edit image titles
Allows non interactive use
One level undo
Calculations:
azimuthal integration
histograms
horizontal or vertical integration, etc.
horizontal, vertical and transversal profiles
Makes a generic operation with one image.
Diffraction simulations:
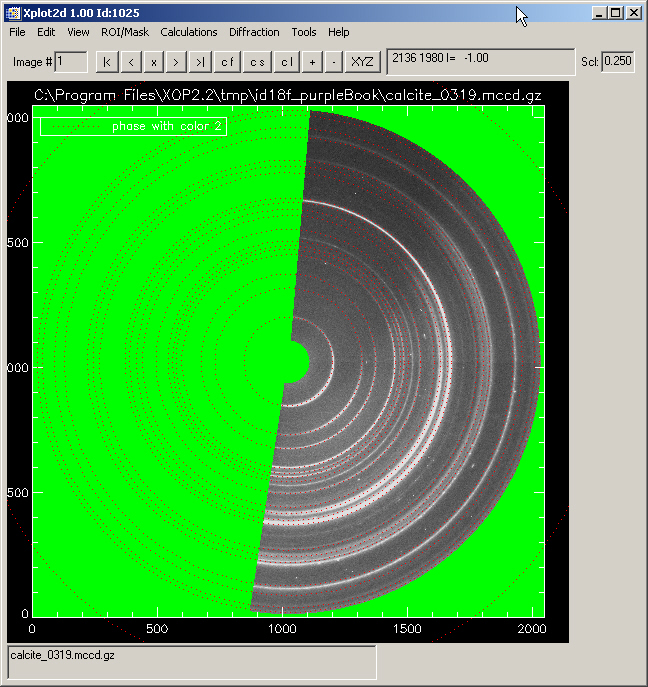
Overplot reference rings from external x-ray diffraction profiles, defined in with either "twotheta" or "d-spacing" files.
Full calibration using circles (detector perpendicular to beam) or ellipses (detector oblique to the beam)
application manual
Stating Xplot2D
reading your first image
Navigating into menus
Zooming
Selecting ROIs
Mask unwanted pixels
Detector parameters
Overplot rings from reference
Calibration of the detector parameters
Azimuthal integration and batch